
Benefits and Belonging: A Museum Membership Benchmarking Survey
Summary Report by Meg Winikates, Director of Engagement, New England Museum Association
Is your membership program your institution’s backbone or its bane? Do you find yourself wondering how your membership program costs and benefits compare with your colleagues’ successes and struggles? To help our own members answer such questions, NEMA periodically surveys the field to take a snapshot of the state of museums and their related institutions. This summer, we asked a series of questions about the logistics, costs, and results of museums’ membership programs, and can now compare that information with previous data collected in a similar survey in 2010 as well as ongoing NEMA programs such as NEMA Stats: A Monthly Museum Attendance Report and Stats Plus.
Who answered?
We had seventy-two responses (72), with a few duplicate institutions, for a total representation of 68 institutions. The roles of those who responded ranged from managers of visitor services to membership managers to executive directors, as well as people working in development, communications, and board members. The majority of responding institutions list themselves as history organizations (61%), approximately a quarter as art museums (24%), and the smallest amount of science and children’s museums (19%, including natural history, aquaria, and zoos). As organizations could identify as more than one category, the percentage is more than 100%. For instance, a handful of institutions also listed themselves as libraries/archives, special collections, or specific branches of history (military, industrial, etc.), and have been aligned with the three primary categories. This is a representative proportion of NEMA’s membership, which also falls along similar lines. Fortunately, it’s also a better representation of the field as a whole than the 2010 survey, which had 63 museums participating, but entirely made of history and art organizations, without statistically significant answers from science or children’s museums.
Useful for making comparisons across time, the 2010 and 2018 surveys had similar breakdowns of institutional sizes. In 2010 and 2018 both, 31% of respondents reported organizational budgets of under $250,000 per year (small). In 2010 26%, and in 2018 24%, were in the $250,000 to $1 million category (medium), and 44% of 2018 respondents had annual budgets of over $1 million (large), much like 2010’s 43%. While large budget museums are therefore over-represented compared to the overall proportions of NEMA’s membership, they are also most likely to have the staff available to answer our benchmarking surveys. For the most part, the large budget categories are predominantly art, science, and children’s museums, with some history organizations that may also count in one of the other disciplines. The small budget category is mostly history organizations, and the middle budget is a mix of the three major disciplines. The geographic distribution of responding museums also maps closely to the proportions of NEMA’s institutional members: 51% Massachusetts, 22% Connecticut, 8% Rhode Island, 7% New Hampshire, 5.5% each Maine and Vermont.
The Basics: Staffing & Participation
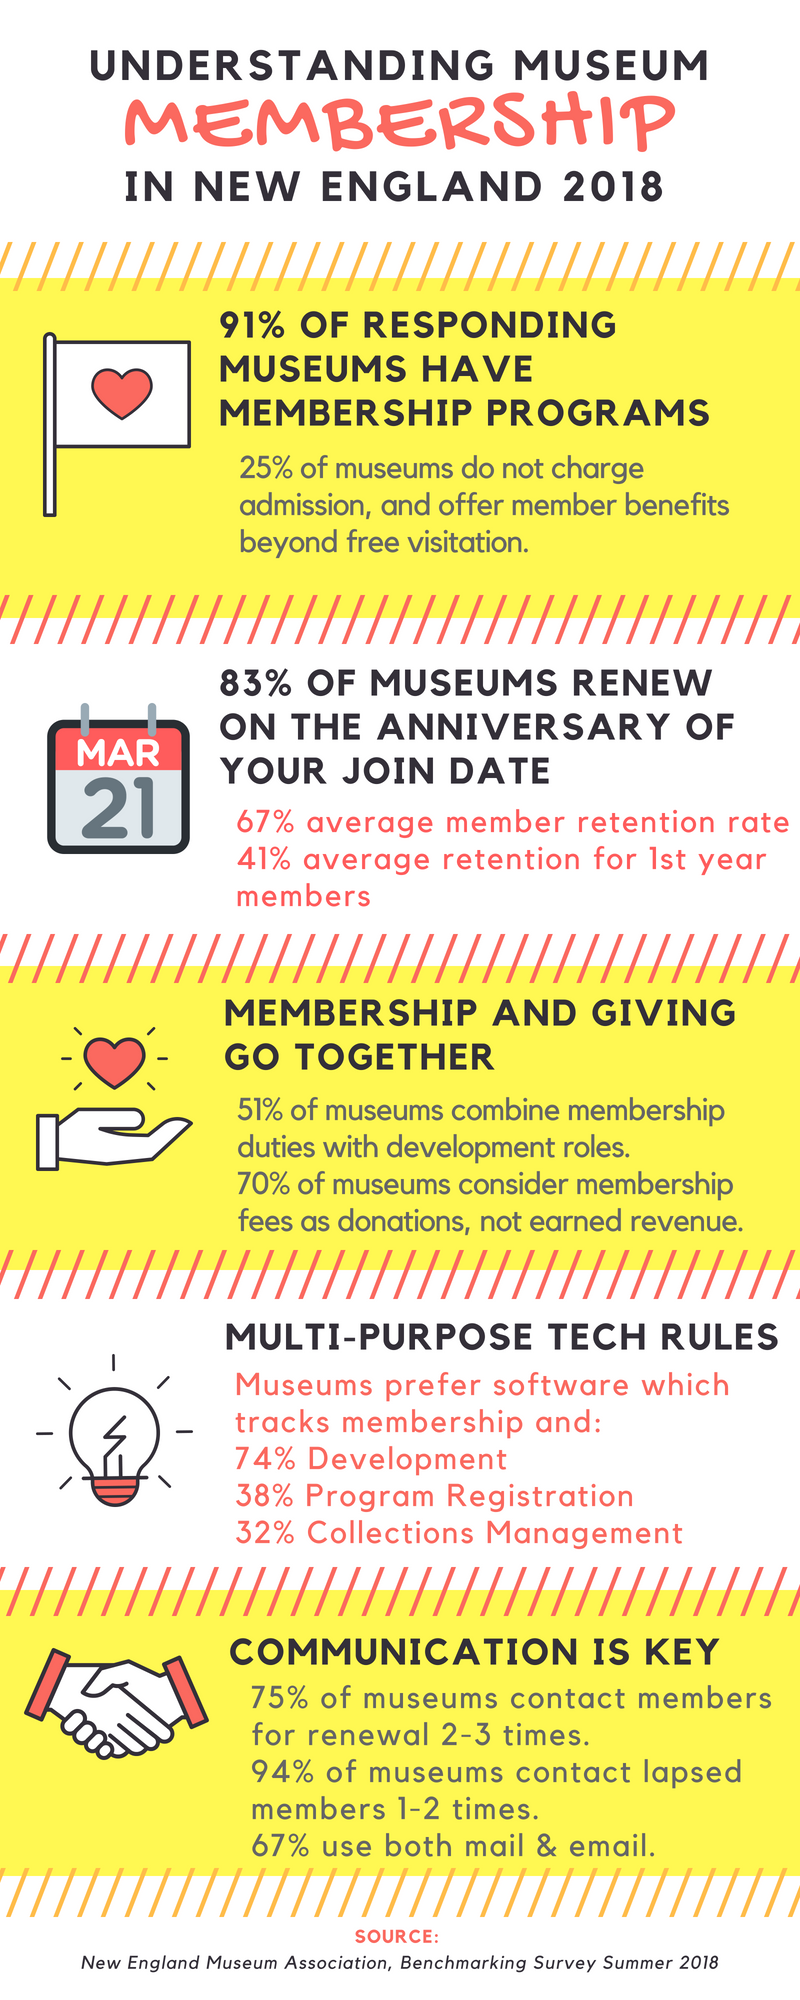
Membership programs remain a staple of museum operations. In 2010, 90% of museums responding said they had membership programs; in this year’s survey, 91% do. Two that do not currently have membership programs are in the process of launching them for this summer or fall. One noted that they do not charge admission, which makes the question of ‘member benefits’ more difficult. Another museum with free admission said they have a “Friends” organization with members instead. As 25% of responding museums reported that they have free admission, however, clearly there are some museums who find ways to offer member benefits that go beyond a discount at the gate.
Membership programs, despite their ubiquity, do not always form the same proportion of a museum’s budget. Respondents reported that membership revenues make up anything from .5% to 90% of the operating budget. Removing those two outliers, the average membership program represents 12% of a museum’s annual operating budget (up from the 9% average reported in 2010).
The responsibility for raising that membership revenue lies in nearly exclusively with museum staff. Only 8% of responding museums reported that board members or volunteers were primarily involved with membership duties. In the majority of responding institutions (51%), membership duties are a part of the development department, with the second most popular option being the administrative staff (i.e. a director’s assistant, operations manager, or similar) at 28%. 13% of respondents said membership was primarily handled by the executive director, 9% by a marketing or external affairs department, and only 3% of respondents have a separate membership department.
Membership is also a role frequently combined with other responsibilities (a common refrain for nearly all museum roles and responsibilities). In 46% of responding organizations, membership is handled by one part-time person, and in another 23%, by one full-time person with part time assistance from others. In 18% of museums, a single full-time person handles membership, and in 12% of museums, two or more full-time people have membership as their primary responsibility (which includes membership-related duties such as formulating strategies, planning events, etc.).
How does this staff investment correlate to museum attendance and participation in membership programs?
The general news for museum attendance in New England is good: according to the NEMA Stats 2017 Annual Report (an aggregate of 119 participating sites), attendance in the region is up 1.8% from 2016, which was itself up dramatically from 2015. According to the more detailed figures produced by a smaller percentage of participating NEMA Stats museums who provide audience breakdowns monthly through Stats Plus (66 participating sites), while non-member visitation regularly outpaces member visitation, member visitation remains mostly steady throughout the seasons, peaking in April and May. This might be accounted for by members returning to seasonal museums early in their opening, or by the popularity of school vacation week programming, particularly in April. By contrast, non-member attendance peaks in June, July, and August. Further longitudinal information will be available starting with the 2018 annual report, as this level of audience detail is only in its second full year of data collection.
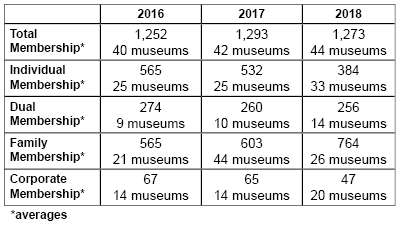
And what of trends in membership renewals? We asked for three years of data on membership totals from participating museums; not everyone answered for all three years, so the averages in the table below include notes on how many museums answered for each year and category. The 2018 numbers are as of whenever participants answered the survey, and therefore may not necessarily reflect the year’s totals by December. However, the trends generally seem to indicate that family membership participation is on the rise in the region as a whole, while individual memberships are decreasing. Dual membership remains approximately steady, and corporate membership is showing some decrease, but might be influenced by the fact that this is a midyear tally rather than end of year. It is also important to note that these averages incorporate both ends of the scale, from the smallest institutions to the largest, and so the membership averages are skewed by the largest museums. Also, in general the numbers reported for total average membership are down from the 2010 study, when the average membership number was 1,621.
Membership Tiers, Costs, and Donations
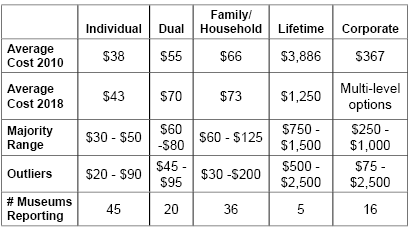
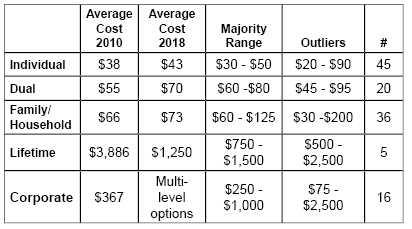
How do museums organize their membership tiers, and how do costs vary in the region? The table below shows the average cost by membership type as well as the range within which most answers fell, and the extreme ends of the scale, as attributable to the smallest and largest museums which offer each of those categories. (Many museums indicated that there were categories they never or no longer offered, such as Dual and Lifetime memberships.) We have also included the 2010 averages for each category: 26% of responding museums report that they have raised their membership rates within the last year, and an additional 24% have raised their rates within the last 2-3 years. 9% haven’t raised their rates for 9-10 years, and 15% of respondents have never raised their membership rates.
As so many institutions combine their membership and development activities through both staffing and software, it makes sense that most consider their membership revenues to count as ‘donations’ (70%) rather than ‘earned revenue,’ especially those memberships which come in at higher tiers (76%). Those who participate in higher member levels are also reliably approached as potential donors beyond the cost of those memberships (82%), and even general members receive appeals for further donations in addition to their renewal fees at the time of renewal (66% of the respondents). While ‘the ask’ is fairly standard, however, the result varies widely. When asked what percent of members donate to an annual appeal, museums responded with answers from “less than 5%” to “90%,” with the most common response being in the mid-20-percents. From the reverse angle, 78% of museums offer member benefits to donors who give at a predetermined level.
Renewals & Retention
Most museums (83%) run their membership renewals on the anniversary of a member’s joining date. The next most popular option is to have all renewals due at the same time of year, regardless of join date (13%), and a handful of museums run their member cycles either quarterly or monthly. The ‘anniversary date’ option has increased in popularity since 2010, when only 63% of museums used this option, and both the ‘once a year’ and ‘monthly’ options have decreased accordingly. It is likely that the increase in using larger-scale member databases with the ability to run automated renewal communications has contributed to the one-to-one member renewal dates. In fact, as detailed in the next section, email communications with members have increased noticeably since 2010.
Retention rates by category
Technology for Tracking, Marketing, and Communication
The range of programs used to track membership remains wide. In 2010, Blackbaud’s Raiser’s Edge was the overall favorite, used by 25% of respondents, with Past Perfect coming in second at 17%. Eight years later, Blackbaud has diversified its offerings, such that it has split its own market share between Raiser’s Edge (16%) and Altru (15%) and eTapestry (1.5%). Past Perfect remains a strong presence in membership software, having actually picked up market share to now be 25% of the responding institutions’ choice.
Software that can serve multiple departments and tasks remains a key decision factor; 74% of responding institutions reported that they also use their membership software for development purposes, while 38% use it for program registration, and 32% for collections management. Those programs which can also cover admissions (21%) and museum store sales (17%) are also seen as useful.
That being said, there are options offered by some of the higher-cost programs, such as barcoded membership cards, which are not being used to their full extent. Only 15% of responding institutions track member attendance through barcoded cards, and only 52% of all respondents even track member attendance at all. Where barcoded cards are used seem to be in larger institutions, and especially among science & children’s organizations (45% use barcodes and 82% track member attendance). Art museums are next, with 29% using barcodes and 53% tracking member visits, while history museums lag technologically, with none using barcode tracking, and only 39% tracking member visitation. This may be linked to the fact that history museums are also the most likely (33%) to offer free admission generally, making free member visitation less of a priority to count.
Auto-renewal of memberships also remains a less popular option. While technology use in renewal is popular (67% of museums send renewal notices by both print and email contacts, and 5% use only email, and 93% accept online renewal payments), only 22% offer an option for automatic membership renewal. Emailed renewal notices, however, are increasingly popular. In general, most museums contact their members two (44%) or three times (31%) before their membership lapses, and once (44%) or twice (50%) after their membership has expired. In 2010, 33% of museums used both snail mail and email to send renewals; now, 67% do, and 5% use email only, when none did in 2010. Email is also a popular choice for contacting lapsed members: 63% of museums use both email and snail mail, and 11% use email only. The telephone has become a significantly less popular option: only 8% regularly call their lapsed or renewing members, and just under 30% report calling ‘sometimes,’ down from 54% in 2010.
In contrast, a museum’s web presence has continued to be ever more important to membership as it is to many other elements of museum marketing. 95% of museums report using their website to market their membership programs, and 83% use social media. While in-museum marketing (a membership desk, signs, posters, etc.) remains the other most popular marketing option (88%), there has been a massive increase in museums that use social media since 2010 (51% as of 8 years ago), with a corresponding decrease in those that use paid advertising (9% in 2018 down from 12% in 2010). Email newsletters have also increased mentions as membership marketing tools compared to the previous survey.
Understanding Membership Benefits & Models
Member benefits have both their staples and their outliers among museum programs. Free admission remains the top benefit (85% of respondents in 2018, 88% in 2010), and shop discounts have overtaken the second spot (up to 85% from 84% in 2010) from a newsletter or magazine (down to 71% for digital options and 68% for a printed magazine from 86% total in 2010). Member-only events or hours have also become significantly more popular, rising from 56% of offerings in 2010 to 73% in 2018, making them now the third most popular member benefit to offer (up from spot #5). Most museums report that they offer somewhere between 3-6 members-only events per year, but others offer a monthly members’ event, and a few outliers offer twenty or more per year. 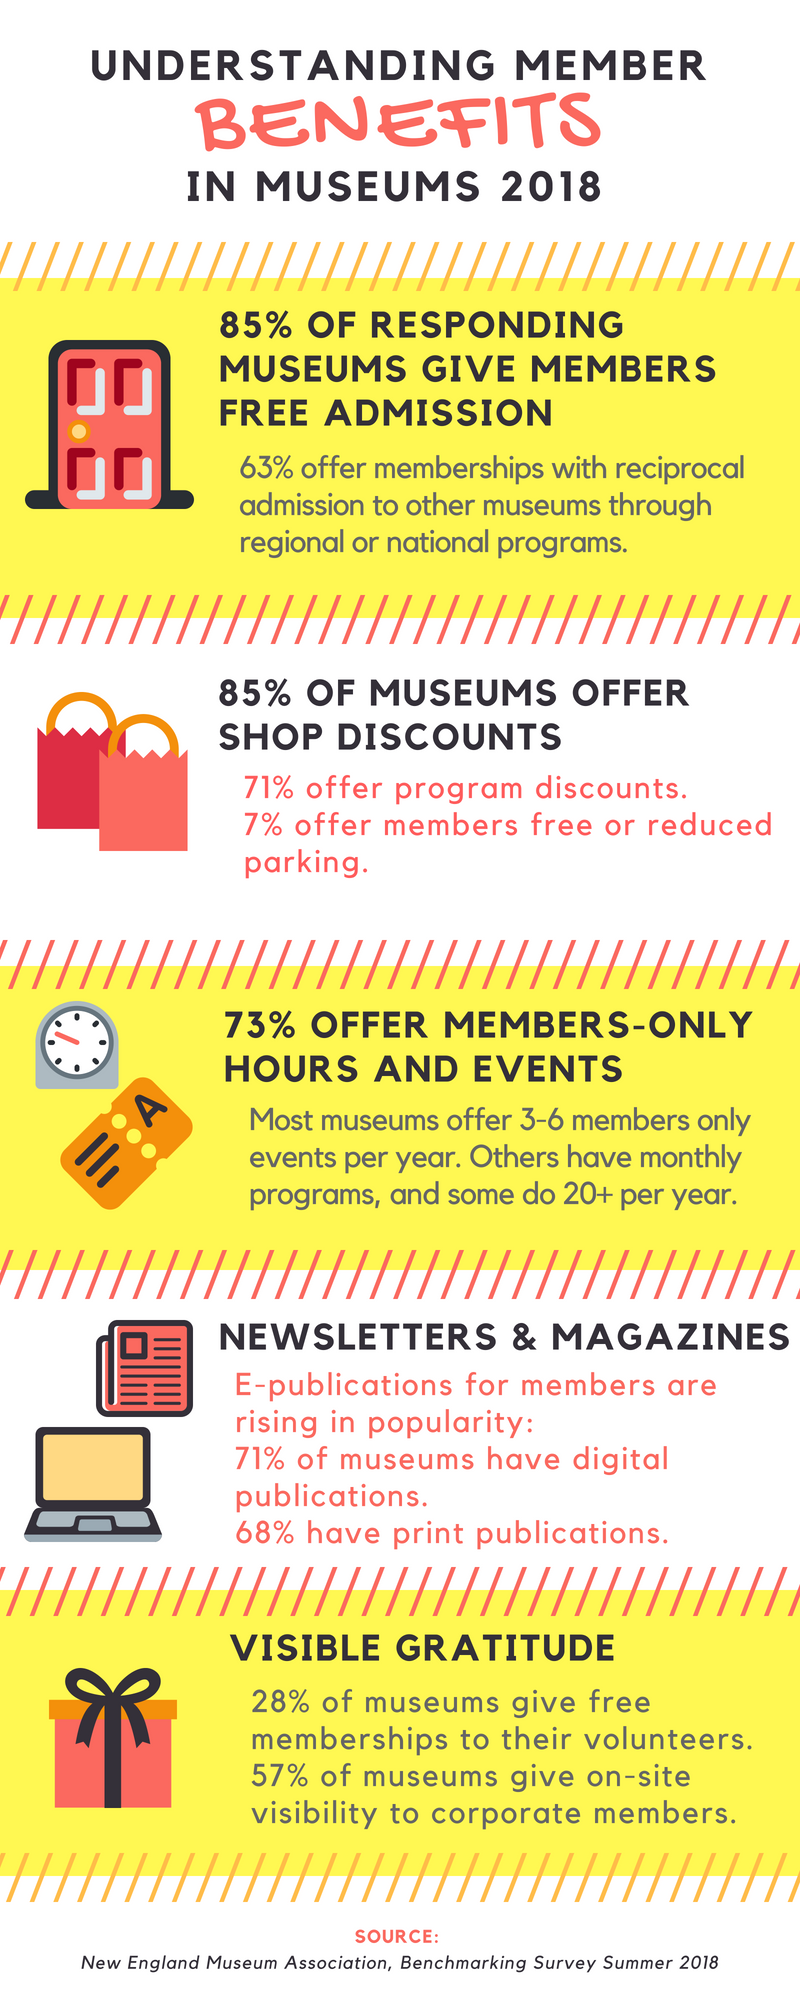
Program discounts remain a steady member benefit (offered by 71% of respondents in both 2010 and 2018), but tours and travel programs have decreased, from 28% to 15%, as has free or reduced parking (from 21% of 2010 respondents to only 7% of 2018 respondents). Merchant and dining discounts remain a small percentage of member offerings, and participation in reciprocal membership programs also. Cooperative memberships with other local area museums (regional ‘art trails’ or similar), as well as national programs (especially among science and children’s museum programs like the ASTC passport) are popular (63% of respondents), though no one reports similar discounts with other kinds of nonprofits such as public broadcasting or environmental organizations. Those that do participate in reciprocal memberships generally find it worthwhile for being able to sell higher-level membership tiers at little to no cost to the museum, though there are occasional logistical headaches and visitor misunderstandings which can make the reciprocal programs more difficult on front-line staff.
Member benefits are also regularly extended to museum volunteers: 28% of reporting museums say they give memberships to their volunteers as a thank you for their service. On the other side of the scale, 11% of museums expect their volunteers to also become paying members of the organization, though some of those institutions do offer memberships at a reduced rate to those volunteers.
Corporate member benefits have also seen some shifts in the last 8 years; in 2010 the most common member benefit for corporations was in-museum visibility for the company name or brand (66%), but in 2018 that has decreased to 57%. Passes for employees have remained a steady benefit (up to 57% from 56%). Fewer museums mentioned free or discounted facility rentals, and instead listed a range of unique benefits such as research services, private tours, and social media recognition.
Though on a cultural level ‘frequent user’ programs have increased dramatically (gas point rewards at the supermarket, rewards tracking apps at coffee shops, etc), they have yet to make it into museum member benefit models; not a single reporting institution said they use any kind of ‘frequent flyer’ style rewards programs. Those museums that report that they are considering changing their membership models (14%) all say they are looking at variations on free memberships that would put the onus of raising funds into an annual appeal or multiple appeals throughout the year, rather than on ‘membership renewal fees.’
Targeted Audiences
Admission discounts, whether one-time or through discounted memberships, are a popular way of reaching target audience segments. There tends to be general agreement across the field on which audience demographics can or should be offered discounts. Most museums do this through a pass program at local libraries and through social service organizations. 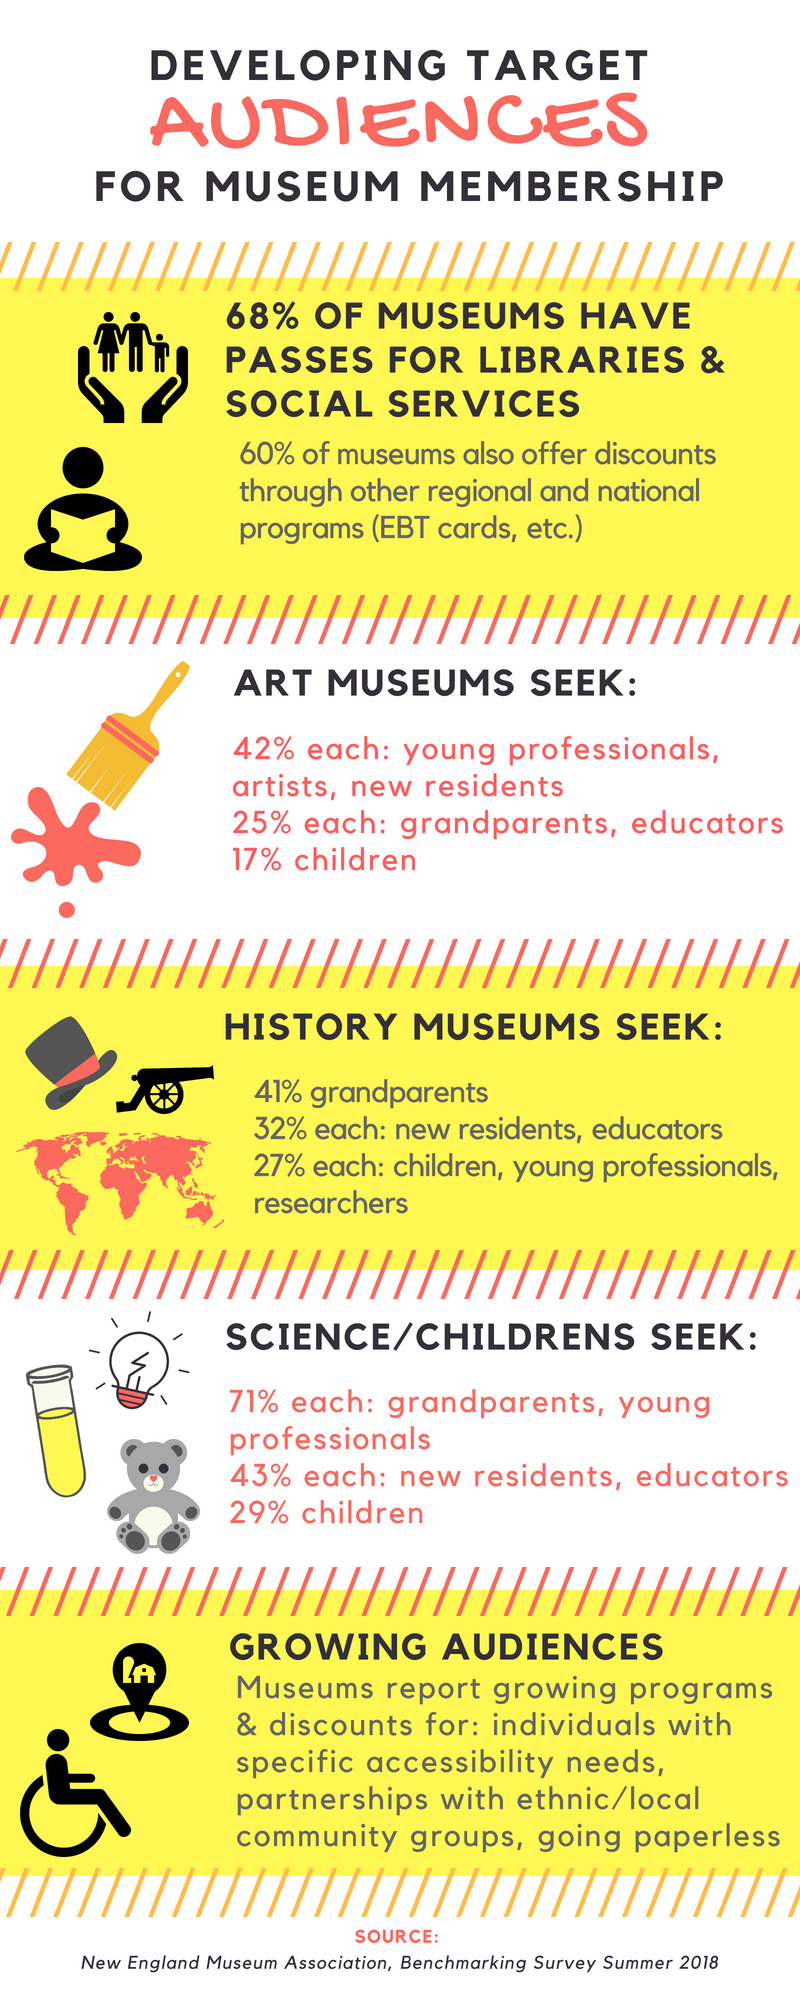
For many museums, the opportunity to reach and serve these audiences goes beyond a pass program. For instance, 62% of responding museums offer discounted membership to students, and 60% offer membership discounts to seniors. Military and their families receive membership discounts at 49% of reporting museums, as do teachers in 36% of organizations in this survey. Other demographics mentioned who receive discounted memberships include local residents, members who are willing to go paperless, artists, and ‘super volunteers.’
Interestingly, the proportion of museums who offer discounts to different audiences varies most by discipline. For instance, the top three discounted categories among art museums are students (84%), seniors (54%), and educators (54%), while in science and children’s museums, the top three are military (71%), then students and seniors (57% each). In history museums, discounted memberships offered are most popular for seniors and military (61% each), students (57%), and then educators (36%).
These discounts tend to align with the reported audiences that museums are targeting for their membership programs, for instance 38% of reporting museums are interested in recruiting grandparents as members, and 28% are interested in recruiting educators. Other popular audience segments for membership recruitment are new residents (recently moved, immigrants, and new citizens, at 31%), children (28%), young professionals (28%), artists (18%), and researchers (15%). A small number of reporting museums also specified that they are specifically reaching out to particular ethnic groups or to individuals with particular accessibility or learning needs. Examples cited include: assisted living residents, blind visitors, Black fraternities and sororities, Latino community groups, and visitors with autism or other sensory issues. One museum noted “We need to do so much more here!” and others noted that they offer programs for some of these groups, which suggests an opportunity for stronger collaboration between staff who focus on education and those who focus on membership.
Again, targeted audiences vary by museum discipline. In science and children’s museums, targeted demographics range thus: grandparents (71%), young professionals (71%), new residents (43%), educators (43%), children (29%), individuals or groups with special needs (14%) with sensory friendly hours specifically mentioned. In art museums, they are most likely to be targeting young professionals, new residents and artists (42% each), then grandparents and educators (25% each), children (17%), then other special groups by access or ethnicity. History museums are a third mix of targeted demographics: grandparents (41%), new residents and educators (32% each), children and young professionals (27% each) tied with researchers (also 27%), and lastly individuals or groups with particular accessibility or learning needs (9%).
Membership Initiatives: Sometimes Fabulous, Sometimes a Flop
Museum staff in all departments are always looking for the new, creative idea that will improve attendance, reach a new audience segment, or improve retention rates of existing museum visitors and fans. We asked responding institutions for some of their most effective ideas in membership—and also for their flops.
Here are a few initiatives that worked:
“We started to wrist band our members with a VIP band versus a solid color used for other visitors. Other visitors are inquiring to our members as to why some have a VIP band and they don't. Our members are actually starting to sell our memberships for us! We are now offering our members "deal of the day" in our giftshop, giving them a much deeper discount than their typical 10 or 20%.”
“Every November is 'Member Month' and we offer a 10% discount if you sign up in the month of November. If a current member renews in that month they receive a free upgrade valued at $20.00.”
Offering extended length of membership came up as a repeated idea, for instance: “We run an 18-month for the price of 12 promotion each holiday season, around a highly-popular annual train exhibition that typically draws new audiences. This has yielded strong return on membership acquisition at the point of sale.”
“During popular weekends we sometimes promote membership with a giveaway i.e. a plant. It seems to help spread the membership message to new visitors.” (Author’s note: Other museums listed ‘offering free stuff’ as an initiative that didn’t work, so audience research seems important if this sounds like an idea to try!)
“We purchased a certain number of Solar Eclipse stamps and those who received them and sent in their renewal were entered to win a prize.”
“Annual Friends of the Reunion Award - present a trophy and flowers during reunion to the college class with the largest number of donors to any membership group on campus. This friendly competition is marketing to reunion year alumnae in the run up to reunion and helps increase alumnae giving around reunion.”
And though some of them were variations on programs that might have worked elsewhere, or which follow conventional wisdom or recommended paths for partnership, some of the following initiatives just didn’t work out for responding organizations:
“We tried a 'New Neighbors Membership' program partnered with Greater Hartford Association of Realtors. It did not bring us any new members.”
“We were surprised that lapsed member appeals were relatively unsuccessful.”
“We offered a perk to visitors (after their visit, via a thank you email) to come back and receive discounted membership and a gift - a book. Very few took advantage of this.”
"Targeting those who purchased online tickets to get a membership later was not successful. The original attempt seemed successful because the pool was 1,000s of visitors. Once that vein was tapped the percent rate lowered.”
“We offer a free membership to give as a gift and special behind-the-scenes tours...but no one redeems them.”
Conclusion
Many of the membership trends between 2010 and 2018 have followed the path of cultural change; while memberships in general seem to be a less popular option, family or household membership remains a strong element of the membership model, showing growth over the last three years. This aligns with data collected nationally in the Culture Track 2017 study, which shows that an increase in “cultural promiscuity” pairs with a growing reluctance to commit oneself and one’s resources to a single or a handful of institutions. However, parents remain “21% more likely than non-parents to join a loyalty program that simplifies their planning; 25% more likely to join because of on-site facilities that simplify their experience, such as on-site childcare, or child-friendly activities; and 31% more likely to join if organizations provide follow-up information so they can easily stay involved. In addition, they are also 36% more likely to desire a membership that includes access to other organizations—which simplifies their lives on an even greater scale.” (http://2017study.culturetrack.com/the-loyalty-revolution)
The continued linking of membership in museums with overall charitable giving is also in line with national trends. The same Culture Track study shows that organizations who are demonstrating social impact are drawing the most charitable dollars and suggests that “cultural organizations need to work harder to measure and then articulate what their distinct impact is.” (http://2017study.culturetrack.com/the-case-for-support)
And while traditional membership models may continue to show signs of strain in future, the overall rise in attendance in New England museums generally, and the number of innovative programs and initiatives mentioned in this survey show that museums still have a great deal of possibility and promise for current and future audiences if we remain flexible, dedicated, and communicative.