
Museum Attendance Trends: The Good, the Bad, and the Ugly
By Meg Winikates, Membership and Advocacy Manager, New England Museum Association
Without our visitors, museums are well decorated warehouses, so we watch our attendance numbers carefully. It can be difficult to discern trends when we look at our individual institutions in isolation, however, which is why NEMA compiles an annual report through our program NEMA Stats: A Monthly Museums Attendance Report. This year-end report for 2015 looks at the immediate year’s attendance in context with the previous ten years. NEMA Stats had 116 reporting sites in 2015, with institutions located in all six New England states, the highest concentration of which are reporting from eastern Massachusetts.
Unsurprisingly, the severe winter weather of early 2015 caused a significant decrease in attendance across much of New England, especially eastern Massachusetts. Looking at the attendance trends of the last ten years, it appears that the weather in February and early March had an equal or greater impact on museum visitation than the bombing at the Boston Marathon in April 2013 and its subsequent closures and public transportation issues in the days immediately following. It is important to note that in 2013 numerous Boston area museums had free admission days and stayed open despite other public facility closures, in order to be a resource and refuge for their local visitors. In 2015, the weather made that kind of response nearly impossible. Many museums reported four or more days of closure due to the weather, with delayed responses in snow clearing continuing to depress visitation numbers after the snow stopped falling. “Problems with snow removal and public transportation caused residual negative effects on attendance for several weeks,” noted one NEMA Stats participant.
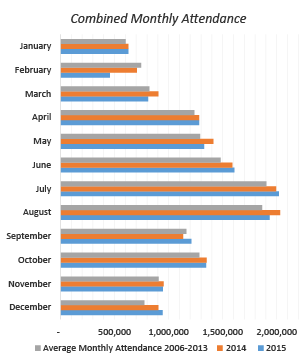
February vacation week was a particular casualty: “Had about 1/2 the attendance we usually have during school vacation week,” stated one museum, and another reported “The record breaking snowfall resulted in the lowest attended February vacation week in nearly 30 years.” Museums north of the greater Boston area also noted a decrease in visitation, as the weather made usual travel patterns out of the city equally difficult. February in total saw only 457,520 visitors across the reporting region, the lowest recorded attendance in the last 10 years.
Fortunately, the year showed some recovery after the intense winter, with museums categorized as ‘primarily outdoor’ experiencing a slight increase in visitation in April with the return of the more temperate weather. June 2015 brought record high attendance compared to the last five years, which many attributed to the Highland Street Free Fun Friday program, as well as strong interest in several traveling exhibitions. July 2015 was the busiest month of the year, with 2,020,268 visitors total.
Fall and winter also showed good visitation; September’s attendance was higher than the monthly average of the last 10 years, and December’s visitation numbers were the highest of the last five years. Participating institutions cited expansions of popular holiday programming, strong draws by traveling and temporary exhibitions, and attendance-driving experiments like Groupon for their high turnout.
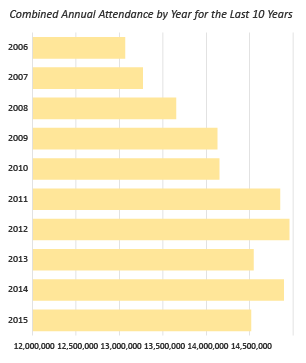
Other dampening factors on 2015 attendance included several museum closures; of the reporting sites, seven had temporary or lengthy closures outside the usual seasonal pattern, which also depressed attendance numbers. Though the total attendance in 2015 (14,515,067) was the lowest of the last five years, the overall trend is still improving, as 2010’s total was still significantly below 2015, coming in at not quite 141,152,000. Looking at the core group of Stats respondents (54 museums with attendance data going back to 2000), attendance has generally been on an upward swing since its nadir in 2005. Reasons for drops in attendance are manifold, and some are immediate and definite; museum construction and closure, local events such as the Marathon bombing or extreme weather. Others are national-level events with more nebulous but still important impact: the rise of ‘stay-cations’ in the wake of 9/11 and increased travel difficulties in 2001-2, the combined effects of the high gas prices in the wake of Hurricane Katrina and the burst of the housing bubble in 2005, the Great Recession in 2008-9. Despite these events the museum world appears, in the microcosm of NEMA Stats, to have returned to pre-9/11 levels of attendance. The numbers on the national level agree.
Attendance is improving nationwide across the arts and cultural sectors. According to the 2015 Portfolio: Culture Across Communities produced by the Greater Philadelphia Cultural Alliance, between the years 2009-2012, total attendance among cultural nonprofits in eleven major American cities (including Boston) increased by 3%, and earned income went up by 25.4%.
In the Americans for the Arts 2014 report, the National Arts Index, they measure engagement with arts at all levels, from attendance and volunteering rates to number of arts-related books published in a year. The most relevant indicator to the museum field measures how many adult respondents to their survey visit an art museum at least once in the preceding year. The data presented in this report show that “the share of total population attending art museums shrank from 15.5 percent in 2003 to 11.5 percent in 2009. Subsequently, it grew closer to mid?2000s levels, reaching 13.1 percent in 2012.” Compared to the much wider fluctuations of attendance at other forms of art (symphony, opera, theater), the reported appeal of art museums has remained essentially steady.
That said, museums do take even small swings in attendance seriously, and the discussion on how to keep museums relevant and appealing is taking place nationally: at conferences, on social media, and in board meetings. Which methods to drive attendance have been the recent favorites of museum leaders? The Nonprofit Finance Fund recently released a report based on their February 2015 survey of nonprofit leaders and their priorities. This report identified the top investments museums were making to improve their understanding of their audiences and to better drive attendance. The top choices in the museum field were “programs for specific target audiences or visitor segments (49%), data collection on audience/visitor preferences and behaviors to inform programs (45%) and arts education programs or partnerships with schools (44%).” You can find out more on what NEMA member museums are doing to drive attendance in our Pulse section here.
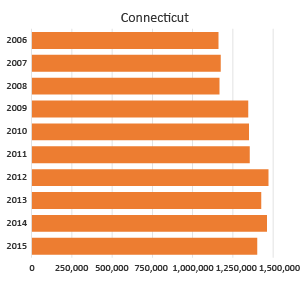
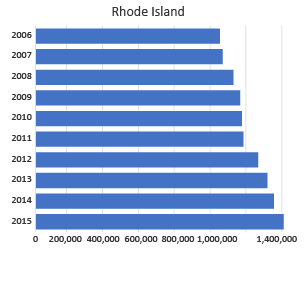
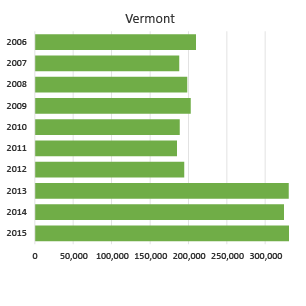
Looking at the most recent NEMA Stats cumulative report, there is also heartening news beyond the pure attendance totals. In a state-by-state breakdown, Rhode Island continues its ten year trend of increased visitation, with a 4.1% increase between 2014-2015 topping out the charts. Maine (2.3%) and Vermont (1.9%) also reported visitation increases in 2015, though New Hampshire reported the greatest decline in 2015 attendance (-11.3%).


When examined by genre of museum the patterns are harder to discern, as New England has many institutions which cross genre and category. Sites that identify as history-related mostly showed increases in 2015, though living history institutions specifically reported decreased attendance. Closures dramatically impacted maritime and military institutions, while most other genres of museums showed attendance drops more in line with the average for the year.
Fortunately, the early numbers for 2016 are promising. Despite there being 26 closed institutions in January (up from 2015’s 18 closures), participating museums still reported a nearly 16% increase in visitation that month. February’s numbers show a 68.4% increase over 2015, with 73% of those visitors being non-members according to the new data coming from the NEMA Stats Plus program. Though as one participant explained the increase as “Weather tells the story,” a sentiment echoed by several others, increased operating hours and popular special exhibits and events also provided incentive for extremely high turnout. The year to date increase as of the end of February currently stands at 37.7%. As data from the new Stats Plus participants accumulates, we look forward to being able to report more granular audience statistics in future.