A gallery study without a gallery: evaluating visitor behavior in an online exhibition
By Alicia Svenson (Northeastern University), Danielle Rose (Northeastern University), and Garrett Dash Nelson (Leventhal Map & Education Center)
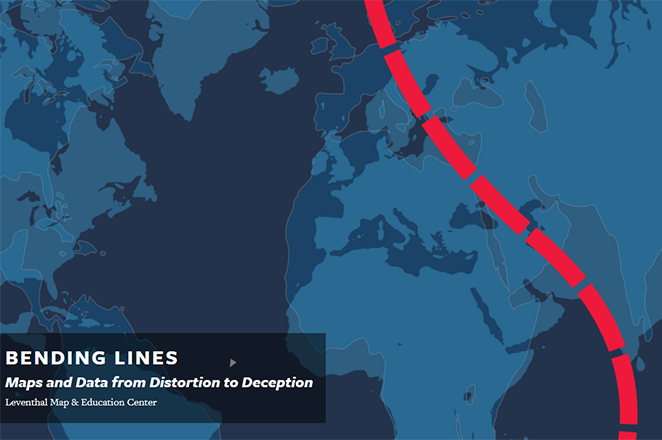
In early March 2020, the Leventhal Map and Education Center (LMEC) was in the process of preparing the Bending Lines: Maps and Data from Distortion to Deception exhibition for their gallery space at the Central Library of the Boston Public Library. Bending Lines explores the various ways that maps and data visualizations shape truth, belief, and trust, featuring both historical examples and modern maps created with geospatial technology.
As part of the exhibition, LMEC was also planning a gallery study for the exhibit, to be conducted by two students in Northeastern University’s Public History MA program, Danielle Rose and Alicia Svenson. The goal was to study how visitors found their way to the exhibit space within the library, and, once there, how they traveled through the gallery’s physical space while viewing the content. However, about a week after the initial meeting for the gallery study, the library closed to the public indefinitely due to the COVID-19 pandemic. LMEC quickly changed course and completely redesigned the physical installation into an interactive online exhibition, which launched in May 2020.
In response to the change in exhibit venue, the evaluation project also required rethinking. While there is considerable literature on conducting space studies of physical galleries, investigating the behavior of virtual “visitors” presents an entirely different challenge. Online exhibits are not new, but they have not been the central focus of most museums and cultural institutions; instead, in the pre-COVID era they tended to be designed as supplementary companion pieces to in-person shows. Some of the fundamental research questions of in-person evaluations are simply impossible—and inappropriate—to replicate when studying an online exhibition. Some of these limitations are obvious; for instance, it is no longer possible to silently observe how visitors travel throughout a space and determine what objects or locations pique their interest. Others are more subtle. What does attention, engagement, and learning even look like on a computer screen where the user may be rapidly toggling between a digital exhibition and many other competing, unrelated stimuli at the same time?
Because visitors enter and experience an online exhibit via a computer or mobile device from any location, at any time, both raw statistics like the number of real visitors, as well as more nuanced questions like whether visitors were able to see how captions referred to images, demand methods that are more familiar to software designers than museum professionals. To explore this question, the Northeastern students used two primary evidence collection methods: data obtained from Google Analytics and website user testing. Both of these methods are routinely used to test and monitor e-commerce and other for-profit websites, but we wanted to explore their utility for online exhibit evaluation.
Google Analytics tracks web page visits and collects certain visitor information based on event triggers which are sent to Google when a page from the digital exhibition is loaded. Some of that information includes the type of device the browser is being used on and browser language; what site or link the visitor used to arrive at the site; the pages looked at during each visit; time spent between page clicks; and the date of each subsequent visit they made to the site. While deeper demographic tracking is possible, these features were not enabled, in order to respect visitors’ digital privacy. In our study, we analyzed data collected between May 27, when the exhibit was released, and August 1. Our main goal was to see whether this data could be translated into useful information about how many visitors came to the site and how they moved around.
In our study of the Google Analytics data, most of our work involved trying to understand exactly what kinds of information can be derived from this “distant” tracking method—as well as what information is impossible to collect in this manner. We found that there are many unknowns in the data, making it most useful for aggregate surveys of visitor volume and acquisition. Even a simple statistic such as “how many users visited the exhibition” can be difficult to track, since Google Analytics includes hits from non-human users such as web scrapers and only imperfectly distinguishes between repeat and new users. It also has no way of telling whether multiple people were looking at the screen at one time when browsing the site.
Because of how the data is categorized, we also found Google Analytics not particularly helpful for determining where users found out about the exhibit. The rapid pivot to a digital exhibition, undertaken in just two months, meant that a full suite of digital marketing efforts was not part of the launch. However, we did find Google Analytics useful for providing information about overall trends among visitors as they interacted with the site. It was particularly helpful as a way to view information on most-visited and least-visited pages, and for an overview of common travel pathways.
We found this information most useful in combination with our user survey. Watching users actually interact with the site helped us understand the data better. Website user testing is a common method for user interface designers to get feedback on the style and usability of their sites prior to launch. While the scope and scale of testing can vary, the basic premise is to have people unfamiliar with your site use it in real time while an observer watches silently. This allows the researcher to determine whether assumptions about how people will use its tools are accurate, and identify potential problem areas. For the purposes of exhibit evaluation we hoped this method would allow us to ask qualitative questions about the exhibition’s content, mission, and navigation.
To design our pilot user survey we first developed a list of questions that we wanted to explore. Did users find all the navigation tools the exhibit provided? Did the interactive components work as expected? We were also interested in hearing from the volunteers about what their expectations were for an online exhibit and how Bending Lines met these expectations.
Because of the ongoing pandemic restrictions, we decided to conduct the surveys over Zoom, and discussed how long we could really ask a volunteer to spend with us. We decided to try to keep each session to 20-25 minutes. Our tasks for the volunteers were divided into two main components. First, they participated in a 5–8-minute session, navigating around the exhibit at their own pace while sharing their screen with us and narrating their thoughts. Second, each user joined us for a 10-minute question and answer session that focused on three central features of the exhibit: content and visual appearance; layout and navigation; and online features.
User surveys are most useful to exhibit design if completed early in the planning process. For instance, in the case of Bending Lines, user testing would have made it immediately clear that the “contents” sidebar menu was difficult for most visitors to find. However, we also found it helpful as an evaluation technique for the completed exhibit as it allowed us to obtain a range of comments about the exhibit. An interesting outcome from the user survey was that the volunteers appeared to have a general expectation of what they thought an online exhibit would include. Many of them expressed their surprise at the sheer amount of content in Bending Lines. As several noted, while they did not feel there was too much information, most “typical” online exhibits are more similar to a thumbnail gallery, with limited text. By contrast, Bending Lines, designed on a custom version of the Quire software created by Getty Publications for digital catalogs, has a volume of material more similar to a book. In general volunteers thought this amount of content was appropriate, and a few noted they were likely to read more text online than in a physical setting since they could set their own pace. At the same time, it is clear from both Google Analytics data and user survey that few, if any, users experienced the entire exhibition.
Regarding navigation, volunteers had very strong and consistent preferences on what they expected. Many made comparisons to navigating a physical exhibit, where the visitor has many spatial cues about the overall size and where they are in relation to the broader structure. One volunteer noted, “you can see where you are going and how to get back.” With the online exhibit, they felt they needed to be more deliberate with their choices. Because the exhibition was deliberately designed with many possible through lines, it obscured any clear indication of how a given view fit into the overall scheme. As such, many users wanted a way to see the entire exhibit at a glance. They also wanted to see a hierarchy of information so they knew what was main content and what was supplemental. In effect they wanted some indication of the spatial metaphor offered by a gallery space, so that they could wander from one page to another with a sense of progression but still have the opportunity to get sidetracked with supplemental content.
After experimenting with these pilot surveys, we determined that we would adjust the browsing time for future surveys. 5-8 minutes was barely enough to scratch the surface of the content-rich Bending Lines exhibit, and most volunteers missed the chance to test many of the interactive features in later sections. Several volunteers wanted to keep going after the initial time period and those who did were able to explore many more features. However, we did feel that the question-and-answer session at the end of the survey was valuable, as it allowed us to directly compare volunteers' answers to one another. Thus, a future study would need to balance the amount of time which it is possible to ask of volunteer participants versus the need to study detailed behavior. Many user testing sessions for commercial sites can be much longer and involve asking testers to complete specific tasks, but these testers are usually paid for their time.
Questions during the question-and-answer period were fairly general and useful for getting good information about overall impressions. We included two questions that used a simple rating system from 1-5 for the overall layout and overall navigation. These ratings, however, were difficult to match with narrative descriptions from participants. For a future survey the methods for finding volunteers might need to be adjusted. The Twitter call for volunteers was not as successful as we hoped. For testing navigation, any volunteers can provide useful information. However, for feedback on the exhibit’s content it would likely be beneficial to find a pool of testers that is representative of the audience the institution hopes will visit the exhibit.
While we still have some unanswered questions, particularly around Google Analytics data, we felt that this data and user survey testing in tandem were useful tools for understanding how visitors are interacting with the Bending Lines online exhibit, offering a sketch of how to conduct “gallery” studies when the gallery exists on individual web browsers in a remote world. Questions that were prompted from an examination of the Google Analytics review became clearer in the user testing. Conversely, general patterns from the user testing were borne out in what we could tell about user behavior in Google Analytics data. A more thorough version of this kind of study would likely involve conducting interviews during exhibition development, rather than solely after it has been released, and also ensuring that a broader sample of participant types are included. Furthermore, we are curious to know more about how visitors engage with the exhibition in a way that is more analogous to a reference text than a gallery exhibition. For instance, do users who spent a half hour “wandering” through the exhibition later return to a single page when they want to think more deeply about something they saw at first glance? These kinds of interactions are very different from the ones we expect in a gallery space, and demand new kinds of participant studies.