Concept, Construction, and Community: 2017 Exhibit Design Benchmarking Survey
By Meg Winikates, Membership & Advocacy Manager, NEMA
This summer, we asked museums, independent designers, and exhibit design firms to contribute their knowledge and practices to a benchmarking survey on the state of exhibit design in museums across New England. One hundred and nineteen (119) results came in primarily from professionals working in museums (77%), with freelance designers the next largest group (19%), and companies the remainder (3%).
Museum Demographics
Museums of all disciplines and budget sizes participated, in similar proportions to most of our previous benchmarking surveys: history museums represented the largest section of respondents (64%), with art museums (26%), and science/children’s museums (12%) following. Almost 7% of museums reported they were attached to academic institutions, 7% focus on industry or transportation, and 5% of responding museums have culturally-specific collections. Institutions were allowed to choose more than one discipline, so some percentages add to more than 100. The majority of responding institutions are in Massachusetts (57%), followed by Connecticut (13%) and Maine (12%), Vermont (7%), Rhode Island (5%), New Hampshire (4%), and 2% were out-of-region responses from New York and Pennsylvania. Budget demographics were nearly evenly distributed along the scale, with 29% of responding museums reporting an annual budget of under $100,000, 27% reporting their budgets ranged from $100,000-499,999, 28% reporting budgets from $500,00-2.9 million, and 16% reporting budgets of over $3 million per year. Small budget museums (under $100K) were overwhelmingly history organizations (82%), as were mid-budget museums ($100K-499K) at 90%. Mid-to-large museums had a wider spread: 48% history, 24% art, 24% science/children’s, 14% culturally specific. The largest museums (over $3mil) were largely art museums (75%), with history and science museums at 25% each.
Museum staff who answered the survey also ranged across roles and responsibilities. Due to the collaborative and often overlapping nature of museum jobs, respondents were allowed to select as many roles as their roles encompass; therefore, the percentages total far more than 100%. Many respondents were in administrative roles (49%) such as executive directors, or curatorial/content expert roles (47%) in addition to those specifically related to exhibit design and installation (43%). 28% of respondents said they had roles in education or interpretation, and another 28% in PR/marketing. 20% of respondents reported their roles to be in community outreach and 12% in facilities management, and 10% work as registrars or collections managers.
Design Responsibilities for Individuals and Teams in Museums
Museums apportion roles in exhibit development out to staff members from many specialties and skill sets. This is important because even among the largest museums, only 58% of them have staff members whose primary responsibility is exhibit design, and only 25% of them have enough staff to constitute an exhibit design/development department with its own budget. Of those 58%, all those staff members are full-time employees, but the design ‘department’ ranges in size from one person to six. For the 42% of the largest museums who do not have dedicated exhibit design staff, primary responsibility for exhibit design belongs to curators or similar content experts 60% of the time, and to outside consultants 40% of the time, with curatorial assistants and installers and art handlers taking on design responsibilities 20% of the time each.
Among museums of smaller budgets, the number of exhibit designers on staff shrinks as well: 33% of mid-to-large budget museums have 1-3 full time or 1 part time designer, and of mid-budget museums, only 5% have 1 exhibit designer on staff. Mid-to-large budget museums are more likely to have other kinds of designers on staff: 21% said that their graphic designers had primary responsibility for exhibit design in the absence of an exhibit design specialist. These museums also rely predominantly on curators (57%) in the absence of exhibit designers, as well as executive directors (36%) and curatorial assistants (29%). This is also the category most likely to give exhibit design duties to educators and interpreters (14%). Mid budget museums also use fewer consultants: only 11% hire outside designers, and instead exhibit development duties rest primarily with the executive director (68%) and the curators (42%).
Among the smallest budget museums (under $100K), there are no museums reporting an exhibit design specialist on staff. 32% of small museums rely on curators and curatorial assistants (14%) to design their exhibits, 23% on executive directors, and 13% on education/interpretation staff. This category is also most likely to rely on volunteers for their design and installation, sometimes including board members with relevant experience. Only 9% work with outside consultants.
Fortunately, museums of all sizes include staff members of diverse experience into their exhibit development teams. The most frequent members of exhibit development teams are curators/content experts (61%), executive directors (49%), and education/interpretation staff (42%). Other popular options for team members include curatorial and research assistants (33%), exhibit designers (30%), graphic designers (28%), installers and art handlers (22%), and fabricators (20%). Less frequent contributors include members of the marketing team (17%), technology or media specialists (13%), outside consultants (12%), and members of community advisory teams (12%). Many museums also wrote in that their exhibits were developed partly or entirely by volunteers, and also called out the support of collections managers and registrars, and occasionally guest curators.
Among art museums, all agreed that a curator or content expert must be on the development team (100%), and a majority include educators and interpreters as well (65%), above even the contributions of executive directors (60%), curatorial assistants (55%), installers and art handlers (45%), or designers (both graphic and exhibit-specific, 45% each). Art museums were more likely than average to include members of their marketing staff (30%) or technology specialists (25%), which may be explained by their also aligning with mostly higher budget brackets.
Among science and children’s museums (also including industrial/transportation, zoos, aquaria, and nature centers), the frequency of roles on the team is more evenly divided. Curators and content experts are only on the team 55% of the time, the same percent as graphic designers, exhibit designers, and educators/interpreters. Fabricators take a role on these teams at a much higher percentage than average (45%), as do technology specialists (36%), and executive directors a much lower percentage than average (27%).
Among history museums, which have the highest percentage of people wearing multiple hats (45%), curators and content experts (51%) and executive directors (47%) still top out the exhibit development teams. Educators and interpreters are included at slightly under the museum-wide average (33%), as are graphic and exhibit designers (20% each), which is not surprising, as 94% of reporting history museums say that they do not have a staff member whose primary responsibility is exhibit design. Fabricators, installers, and technology specialists are the least likely to be included in history exhibit development teams (8% each).
As only 25% of reporting museums have an exhibit design department, the following budget ranges are based on a small sample size. 28% reported a departmental budget (excluding salaries) of $10K-50K, and 17% each reported in the top and bottom ranges of less than $4,999, and over $250K, with the rest ranging approximately evenly across the rest of the scale.
Sources for exhibition budgets also vary widely: most responding institutions receive no government money for exhibits, though the few that do average 5% of their exhibit budget in government dollars (discounting one outlier who receives 50% of their exhibit funding from government sources). Most museums get most of their exhibit funding through their operating budgets (averaging 94% of budget funds), with grants as the second most frequent source of exhibit funds (averaging 64%). Sponsors and donors each come in as averaging just under half of the funding available for exhibit development and installation (45% and 49% respectively).
What does exhibit change and space look like?
Size and changeability vary widely across New England museums. In this survey, there was a nearly even spread in the question regarding how often participating museums change over an entire exhibit space: 14% change five or more times per year, 14% never change an entire exhibit space, and the rest fall nearly equally into all the possible options between. In general, art museums average more frequent exhibit overhauls (60% change three or more times per year, and only 5% do not do entire gallery rotations). Science and children’s museums are most likely to change over exhibits every 2-4 years (33%), which may correlate with children’s pleasure in repeating familiar experiences, instead of constantly seeking new reasons to return to the same place. History museums have the widest spread of exhibit rotations, though the majority change their exhibit spaces every year (23%) or few years (27%), as opposed to multiples times per year.
For smaller rotations (changing objects or exhibit elements within a gallery without changing the entire display), most museums concentrate on rotating at intervals between 3-6 months (47%), and only 12% never rotate their objects. This does not include the addition and subtraction of holiday decorations, but does include seasonal changes such as differences in food or clothing displays to reflect the current time of year.
Museums also work hard to minimize disruption to the galleries for rotations: 65% of museums take less than a month to change over a gallery, with nearly 50% taking less than 2 weeks. This is particularly impressive when you consider the size of some of the spaces involved: though most museums (56%) report that their rotating exhibit space is between 500-1500 square feet, 14% have exhibit space of over 5,000 square feet, and about half of survey respondents have more than one exhibit space dedicated to rotating exhibits. 88% of those multi-space museums have small exhibit spaces (under 500 square feet), but another 83% have spaces that top out at 3,100-5,000 square feet. Small wonder, with that much space to fill, that most temporary exhibitions last several months, from 3-6 months (63%) to 6 months to a year (24%).
Partnerships and Travel: Exhibit Spaces Beyond the Museum
For the amount of work that goes into creating an exhibit, many in the museum field advocate for extended lifespans for their exhibitions, online, on Main Street, or on the road. Most reporting museums do not have or use outdoor exhibit space on their campus (59%), but despite the vagaries of New England weather, 35% do make use of their outdoors, and a further 6% are working on plans to do more with their outdoor options.
Similarly, 40% of responding museums make use of satellite exhibit space, such as creating small exhibits or loaning objects to local libraries or businesses, and another 12% are pursuing such options. Occasionally, exhibits developed at home also travel, as 33% of reporting museums create exhibits for the circuit up to half of the time, and 2% do so more than half the time, with 14% interested in creating a traveling exhibit program. Art museums are the most likely to create exhibits that travel (53% half the time, and 5% more than half), and history museums are the most likely to utilize satellite spaces in town to extend their reach (50%, with another 20% researching possibilities).
Accessibility and Comfort
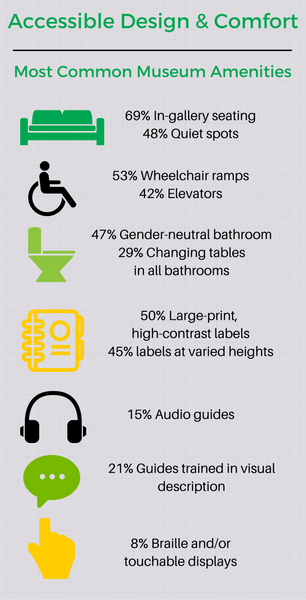
Making our spaces visitor-friendly is a key piece of exhibit design. While some museums have nearly infinite options in large spaces and healthy budgets, others work within the confines of historic structures or tight monetary restrictions. Regardless of museum budget, physical size, or discipline, however, museums have gotten creative in ways to make their spaces more welcoming and accessible. The most popular and expected option is in-gallery seating, a benefit provided by 69% of the museums responding to our survey, and 48% provide quiet spaces for resting and contemplation. The percentage is highest among art museums, 95% of which provide in-gallery seating, and 74% have quiet spaces set aside for rest and reflection, though science and children’s museums also do well with these at 89% each.
For those with mobility limitations, 53% of museums provide wheelchair ramps, 42% provide elevators, and several wrote in to specify that they also provide wheelchairs when requested. 45% said they install labels at varied heights to make reading easier for children and people in wheelchairs, and others wrote in to say they had additional lighting to aid visibility in low-lit period rooms. Science and children’s museums do best with varied exhibit heights: 100% reported that they vary their displays for easier viewing. 50% said their exhibit labels are large-print and high-contrast for easy reading, though the percentage is highest among science and children’s museums, at 67%. 21% of museums offer guides trained in visual description to aid visitors with low vision, and 8% provide labels in Braille or have touchable displays. Audio guides are available in 15% of reporting museums, and one museum highlighted their videos with ASL interpreters to accompany audio stations in their galleries.
Regarding other forms of visitor comfort, 47% of museums reported offering gender-neutral bathroom options, and 29% offer changing tables in all bathrooms regardless of gender. A further 6% have dedicated nursing rooms separate from restrooms.
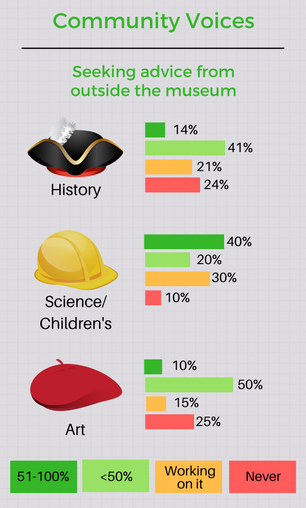
Community advisors
Among history museums, 41% of them say that they consult with members of a targeted or interested community when developing exhibits at least occasionally (less than half the time), 12% do so more than half the time, and 2% always do. 21% are currently working on setting up advisory options.
Reporting art museums say 50% of them consult with community advisors less than half the time, and 10% say they frequently or always do. Art museums considering setting up advisory options make up another 15%, with a quarter saying that’s never part of their development process.
Science and children’s museums have the highest reported interest in working with community advisors, though they also had the smallest sample size, so the percentages are disproportionate to the sample sizes of the history and art disciplines. 20% of reporting science and children’s museums always work with community advisors, and another 20% do so more than half the time, 20% at least occasionally, and 30% are pursuing options. Only one museum stated that community input was not part of their development process.
Freelance and Business Member Demographics
Twenty seven respondents were not affiliated with a particular museum: 15% answered the survey on behalf of their design company, and the other 85% were freelance designers. When asked about the strengths of themselves and their companies, 50% of respondents picked education/interpretation, 43% picked exhibit layout and overall design, 36% picked content expertise, and 29% low-tech/no-tech interactives and games.
When asked what discipline of museum these outside designers primarily work with, 71% answered history, 57% art, 43% each science and children’s museums, and 29% industrial and transportation. In general, contract designers say they work on 2-3 projects at a time (54%), while some prefer to concentrate on a single project (23%), and none take on more than 4-5 in a single period (also 23%). Most like a 3-4 week lead time to prepare a proposal for a client museum (46%), and a handful prefer a long time to brainstorm (15% take 3 or more months), but many agree that it varies widely depending on the size of the project for both planning a proposal (31%) and completing a design (42%). Otherwise, most aim to complete a project in 3 to 6 months (42%), while some smaller projects allow for completion within 1-2 months (17%).
Freelancers & Design Companies Working With Clients
In the interests of providing information to those museums not yet working with outside contractors for their exhibit designs, we asked the freelance and business members who responded to this survey to tell us about their process and preferences when working with museum clients. When considering contact between the museum and the outside designer, designers prefer to have a range of museum staffers on the development team: 79% prefer to work with the curator or content expert on the project, 64% with the executive director, 57% with any other exhibit designers on the project, 43% with education and interpretation staff, and 29% with fabricators.
To stay in contact with their museum clients, the most popular method of communication is informal emails (86%), with both introductory and follow-up in-person meetings popular with 64% of respondents. Only half (50%) require a final approval meeting, and opinion seems equally split (36% each) on the value of formal emailed or mailed progress reports, scheduled check-in calls, or an intermediate feedback-focused in-person meetings.
As with museum exhibit developers, NEMA’s business members are also aware of the value in involving advisors or feedback from targeted communities. 79% of respondents say they work with community advisors occasionally (43%), frequently (22%), or always (14%). The willingness to work with people outside the community is also tempered with caution in several responses, describing such efforts as “loaded” or “problematic.” As one respondent said, “That level of investiture has been hard to develop. But, in the development of a new bi-lingual exhibit for a client we built a team of collaborators and testers that drew from a pool of visitors and outside historians. It gave the team an inclusive view of access from visitor experience in the museum to collections management. Specific desires from prospective visitors drove reorganization of content in new and surprising ways. The exhibit has since deeply engaged a visitor base the client was having trouble speaking to and increased supporting membership from that group.”
Respondents also highlighted the importance of asking questions in any project; as one respondent says “Forming the concept of an exhibit is often complicated by the lens a group or individual expert brings to the task, myself included. Often I have found there are blind spots and you have to keep chipping away at previously held beliefs.”
Tools & Resources from across the field
While digital tools have ‘wow’ factor, the field of museum exhibit design still has a lot of faith and trust in the analog design process: creating physical 3D models, sketching with paper and pencil, and assembling exhibit elements on bulletin boards remain popular for full half of survey respondents. Those who use digital tools mentioned (in descending order of popularity) SketchUp, the Adobe Creative Suite (including InDesign, Illustrator, and Photoshop), Microsoft Office products (specifically Excel and Powerpoint), Vectorworks, Canva, BimX and Rhino. Several also mentioned the importance of prototyping to their design process, and mentioned the benefits to following other museums on Instagram and other social media channels to get inspiration.
The following are a list of useful books and resources compiled by survey respondents:
Books & Journals
Designing for Interaction, Bill Moggridge
The Field Guide to Human-Centered Design, IDEO
Thriving in the Knowledge Age, John Falk & Beverly Sheppard
Things That Talk, Edited by Lorraine Daston
National Association for Museum Exhibition & their journal, Exhibition
Planning for People in Museums by Kathleen McLean
Exhibit Makeovers by Alice Parman
Exhibit Labels by Beverly Serrell
The Manual of Museum Exhibitions, Lord and Lord
Interior Lighting for Designers, Gary Gordon
The Measure of Man and Woman: Human Factors in Design, Dreyfus Associates